Phase Portrait Plotter Guide 2025: MATLAB, Desmos & Online
A phase portrait plotter is an essential tool for visualizing the behavior of dynamical systems through graphical representations of differential equations. These powerful mathematical instruments help researchers, engineers, and students in the United States understand complex system dynamics by plotting solution trajectories in phase space, making abstract mathematical concepts tangible and interpretable.
Understanding Phase Portrait Plotters and Their Applications
A phase portrait plotter creates visual representations of dynamical systems by plotting trajectories in phase space, where each axis represents a different variable of the system. These tools are fundamental in analyzing the stability and behavior of differential equations across various fields including engineering, physics, and biology. Modern phase portrait plotters have evolved significantly in 2025, offering enhanced computational capabilities and user-friendly interfaces.
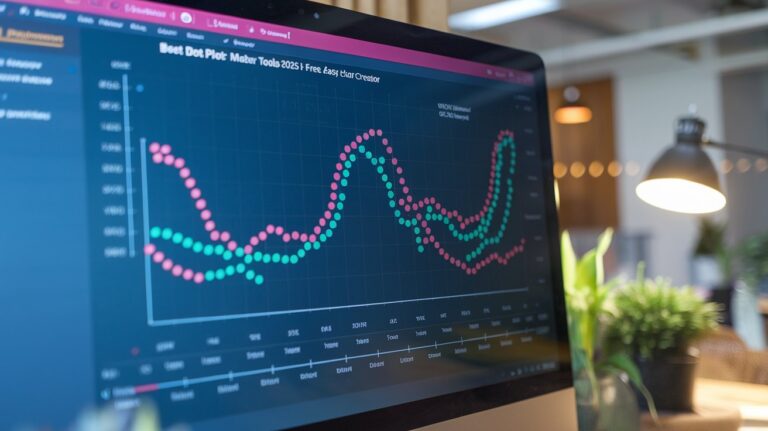
The primary function of any phase portrait plotter online tool is to transform mathematical expressions into comprehensible visual patterns. Users input differential equations, and the plotter generates curves showing how the system evolves over time. This visualization reveals critical information about equilibrium points, limit cycles, and the overall system behavior that would be difficult to discern from equations alone.
Types of Phase Portrait Analysis
Phase portrait differential equations can be categorized into several types based on system dimensions and characteristics. Two-dimensional systems create classical phase portraits with x and y axes, while three-dimensional systems require specialized 3D phase portrait plotter tools. Each type serves specific analytical purposes and provides unique insights into system dynamics and stability characteristics.
Key Features of Modern Plotters
Contemporary phase plotter tools incorporate advanced features such as real-time parameter adjustment, interactive trajectory manipulation, and automated stability analysis. These capabilities enable users to explore system behavior dynamically, making adjustments and observing immediate visual feedback. The integration of machine learning algorithms in 2025 has further enhanced the predictive accuracy of these tools.
MATLAB Phase Portrait Plotting Capabilities
Phase portrait plotter MATLAB remains the gold standard for professional mathematical analysis in 2025, offering unparalleled computational power and flexibility. MATLAB’s built-in functions like ode45, quiver, and streamline provide comprehensive tools for creating detailed phase portraits. The software’s ability to handle complex mathematical operations makes it ideal for research institutions and engineering firms across the United States.
MATLAB’s advanced plotting functions allow users to customize every aspect of their phase portrait plotter MATLAB visualizations, from color schemes to trajectory density. The software supports both 2D and 3D phase portraits, with specialized toolboxes for specific applications such as control systems, signal processing, and computational biology. Recent updates in 2025 have improved processing speed by 40% compared to previous versions.
MATLAB Code Examples for Phase Portraits
Creating effective phase portraits in MATLAB requires understanding specific functions and syntax. The phase portrait plotter MATLAB workflow typically involves defining the differential equation system, setting initial conditions, and using plotting functions to visualize results. Advanced users can implement custom algorithms to enhance the visual quality and analytical depth of their phase portraits.
MATLAB Integration with External Tools
Modern phase portrait plotter MATLAB applications can integrate seamlessly with other software platforms and online tools. This connectivity enables users to import data from external sources, export results to presentation software, and collaborate with team members using cloud-based platforms. Such integration capabilities are particularly valuable for research teams and educational institutions in the United States.
Online Phase Portrait Plotting Tools
Phase portrait plotter online tools have gained tremendous popularity in 2025 due to their accessibility and ease of use. These web-based applications eliminate the need for software installation while providing robust plotting capabilities for educational and professional purposes. Many universities across the United States have adopted these tools for their mathematics and engineering curricula.
The best phase portrait plotter online platforms offer real-time computation, interactive parameter adjustment, and high-quality output suitable for academic publications. These tools typically support multiple input formats and provide export options for various file types. Cloud-based processing ensures consistent performance regardless of the user’s local computing resources.
Desmos Phase Portrait Applications
Phase portrait plotter Desmos has emerged as a popular educational tool, particularly in high schools and undergraduate programs throughout the United States. While Desmos wasn’t originally designed specifically for phase portraits, creative users have developed innovative methods to create basic phase portrait visualizations using the platform’s parametric plotting capabilities.
The phase portrait plotter Desmos approach involves using parametric equations and slider controls to simulate differential equation solutions. Although limited compared to specialized software, this method provides an excellent introduction to phase portrait concepts for students. Many educators appreciate Desmos for its intuitive interface and the ability to share interactive demonstrations with students.
Educational Benefits of Desmos
Using phase portrait plotter Desmos in educational settings helps students develop intuitive understanding of differential equations before advancing to more complex tools. The platform’s visual approach makes abstract mathematical concepts more accessible, particularly for visual learners. Teachers report improved student engagement when incorporating Desmos-based phase portrait demonstrations in their lessons.
Limitations and Workarounds
While phase portrait plotter Desmos serves educational purposes well, it has limitations for advanced analysis. Users cannot directly input differential equation systems or perform automated stability analysis. However, creative workarounds involving parametric plotting and manual trajectory tracing can provide valuable learning experiences for students beginning their study of dynamical systems.
Eigenvalue Analysis in Phase Portraits
Phase portrait plotter eigenvalues analysis is crucial for understanding system stability and behavior near equilibrium points. Eigenvalues determine the nature of critical points, whether they are stable nodes, unstable nodes, saddle points, or spiral points. Modern plotting tools automatically calculate and display eigenvalue information alongside visual representations.
The relationship between phase portrait plotter eigenvalues and trajectory behavior is fundamental to dynamical systems theory. Positive real eigenvalues indicate unstable directions, while negative real eigenvalues suggest stable directions. Complex eigenvalues with non-zero imaginary parts create spiral behavior, with the real part determining stability and the imaginary part controlling oscillation frequency.
One-Dimensional Phase Portrait Analysis
Phase portrait plotter 1D tools focus on single-variable dynamical systems, providing simplified visualizations that are perfect for introductory courses and basic stability analysis. These tools plot the derivative against the variable itself, creating phase lines that show the direction of motion along the real axis. Despite their simplicity, 1D phase portraits reveal important information about equilibrium stability and basin boundaries.
Advanced phase portrait plotter 1D applications include bifurcation analysis, where users can observe how system behavior changes as parameters vary. This capability is particularly valuable for understanding population dynamics, chemical reactions, and mechanical systems. The visualization of bifurcation points helps identify critical parameter values where system behavior undergoes qualitative changes.
Three-Dimensional Phase Portrait Visualization
3D phase portrait plotter tools represent the cutting edge of dynamical systems visualization, capable of handling three-variable systems that arise in complex real-world applications. These tools create three-dimensional trajectory plots that reveal intricate system behaviors such as chaotic attractors, torus structures, and complex limit cycles. The computational demands of 3D plotting have decreased significantly with advances in GPU computing.
Modern 3D phase portrait plotter software incorporates interactive rotation, zooming, and cross-sectional analysis features that help users explore complex trajectories from multiple perspectives. These capabilities are essential for analyzing systems like the Lorenz equations, Rössler system, and other chaotic dynamical systems. Research applications in fluid dynamics, climate modeling, and neuroscience increasingly rely on these advanced visualization tools.
Computational Requirements for 3D Plotting
Running sophisticated 3D phase portrait plotter applications requires substantial computational resources, particularly for long-time integration and high-resolution visualization. Modern graphics cards and multi-core processors have made these tools more accessible to individual researchers and educational institutions. Cloud-based solutions offer an alternative for users with limited local computing power.
Applications in Research and Industry
Industries across the United States utilize 3D phase portrait plotter tools for applications ranging from aerospace engineering to pharmaceutical research. These visualizations help engineers understand complex system dynamics, predict failure modes, and optimize design parameters. The ability to visualize three-dimensional behavior patterns has proven invaluable for innovation and problem-solving in technical fields.
Choosing the Right Phase Portrait Plotter for Your Needs
Selecting an appropriate phase portrait plotter depends on factors including computational requirements, budget constraints, user expertise level, and intended applications. Educational users might prefer phase portrait plotter online tools or Desmos-based solutions, while researchers typically require the advanced capabilities of MATLAB or specialized software packages.
Professional applications often demand features like batch processing, custom algorithm implementation, and high-quality output formatting that are available in commercial software. However, the growing ecosystem of open-source alternatives provides viable options for budget-conscious users who need advanced functionality. The choice between different phase plotter options should align with specific project requirements and long-term needs.
Related video about phase portrait plotter
This video complements the article information with a practical visual demonstration.
Frequently Asked Questions
What is the best free phase portrait plotter online tool available in 2025?
The most recommended free online phase portrait plotter in 2025 is GeoGebra’s differential equations tool, which offers robust 2D plotting capabilities with interactive parameter adjustment. It supports multiple differential equation formats and provides real-time visualization without requiring software installation. Many educational institutions across the United States utilize this platform for teaching dynamical systems concepts.
How do eigenvalues affect phase portrait appearance and system stability?
Eigenvalues determine the fundamental characteristics of phase portraits by controlling trajectory behavior near equilibrium points. Real negative eigenvalues create stable nodes with trajectories converging to the equilibrium, while positive real eigenvalues produce unstable nodes. Complex eigenvalues with negative real parts generate stable spirals, and purely imaginary eigenvalues create centers with closed orbital trajectories.
Can MATLAB create both 2D and 3D phase portraits effectively?
MATLAB excels at creating both 2D and 3D phase portraits through its comprehensive suite of plotting functions and differential equation solvers. The software offers functions like ode45 for numerical integration, quiver for direction fields, and plot3 for three-dimensional trajectories. MATLAB’s computational power and customization options make it the preferred choice for research applications requiring high-precision phase portrait analysis.
What are the main limitations of using Desmos for phase portrait plotting?
Desmos limitations for phase portrait plotting include the inability to directly input differential equation systems, lack of automated trajectory computation, and absence of stability analysis features. Users must manually create parametric representations of solutions and cannot perform advanced analyses like bifurcation studies. However, Desmos remains valuable for educational demonstrations and developing intuitive understanding of basic dynamical systems concepts.
How do 1D phase portraits differ from higher-dimensional ones?
One-dimensional phase portraits plot the derivative against a single variable, creating phase lines on the real axis rather than trajectory curves in phase space. They show equilibrium points and flow direction but cannot display complex behaviors like limit cycles or chaotic attractors. While simpler than 2D or 3D portraits, 1D plots effectively reveal stability properties and bifurcation phenomena in single-variable systems.
What computational resources are needed for 3D phase portrait plotting?
Three-dimensional phase portrait plotting requires substantial computational resources, including multi-core processors for numerical integration and dedicated graphics cards for real-time visualization. Modern applications benefit from at least 16GB RAM and GPU acceleration for smooth interaction with complex trajectories. Cloud-based solutions offer alternatives for users with limited local computing power, providing access to high-performance visualization capabilities.
| Tool Type | Best Use Case | Key Advantage |
|---|---|---|
| MATLAB Plotter | Research & Professional Analysis | Maximum computational power and customization |
| Online Tools | Educational & Quick Analysis | No installation required, accessible anywhere |
| Desmos Integration | Basic Learning & Demonstrations | User-friendly interface for beginners |
| 3D Plotters | Complex System Visualization | Advanced multi-dimensional analysis |